
Across England and Wales, burglary is falling. Police forces logged 208,612 burglary reports in the latest 12-month figures compiled by CrimeRate (down 8% on the year before), putting the national rate at 3.13 burglaries per 1,000 people. London’s total fell too: about 47,400 burglaries in the year to May 2026, down 5.4%, according to Plumplot’s analysis of Met Police data. That still works out at roughly 130 burglaries across the capital every single day.
So far, so encouraging. Then you sort the table.
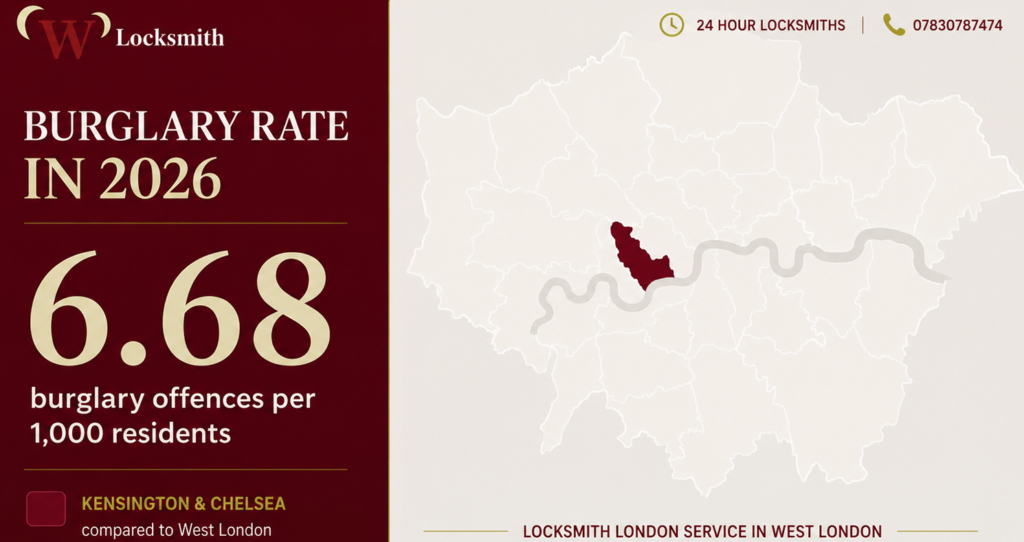
Because the place with the highest burglary rate of any town, city or borough in England and Wales right now is not somewhere with a rough reputation. It’s the Royal Borough of Kensington and Chelsea (the postcard heart of West London) and the patch we cover every night as West London’s local locksmiths.
The Headline Numbers
| Measure | Figure | Period | Source (police.uk data via) |
|---|---|---|---|
| Kensington & Chelsea burglary rate | 6.68 per 1,000 — highest in England & Wales | 2026 (latest 12 months) | CrimeRate |
| Next highest nationally | Leeds 6.40 · Middlesbrough 6.06 | 2026 | CrimeRate |
| National burglary rate | 3.13 per 1,000 (down from 3.42) | 2026 vs 2025 | CrimeRate |
| London burglaries | ~47,400 — down 5.4% year on year | Jun 2025 – May 2026 | Plumplot |
| K&C, single month | Worst burglary rate in London: 117 burglaries | January 2026 | CrimeRate |
| Paddington | 220 burglaries · 5.63 per 1,000 (1.8× national) | 12 months to Apr 2026 | CrimeRate |
| Holland Park | 70 burglaries · 5.84 per 1,000 (1.86× national) | 12 months to Mar 2026 | CrimeRate |
| Earl’s Court | 178 burglaries · 11 per 1,000 (3.4× national) | 12 months to Apr 2026 | CrimeRate |
In other words: while burglary falls nationally, the wealthiest corner of West London is heading the national table, at more than double the England and Wales rate.
Why the Postcard Borough Tops the Table
Part of the answer is arithmetic, and it’s only fair to say so. CrimeRate’s headline figure uses daytime population, and K&C’s resident population is small for the volume of property it contains — which pushes the rate up. But the gap doesn’t disappear when you switch denominators: CrystalRoof’s resident-based figures for December 2024 to November 2025 still put K&C’s burglary rate at 9.02 per 1,000 residents against 6.57 next door in Hammersmith and Fulham. However you count it, this borough is burgled more, relative to its size, than almost anywhere in the country.
The rest of the answer is the part we see through the letterbox every week. After eight years attending West London break-ins, the pattern is consistent: burglary follows opportunity, and K&C’s beautiful housing stock is full of it. This is why we run a dedicated burglary repair service .
Grand stucco terraces converted into six flats behind one tired communal lock. Basement entrances invisible from the street. Original Victorian sashes nobody wanted to “spoil” with proper locks. Garden squares offering rear access no passer-by will ever see. All these add the highest concentration of valuables in Britain and constant visitor footfall for cover, and the table starts to explain itself.
Here’s how that plays out area by area.
Area by Area: The Most Burgled Parts of West London
Notting Hill (W11). In October 2025 alone, police recorded 50 burglaries within half a mile of Notting Hill Gate, per StreetCheck’s log of police.uk data and CrystalRoof puts the burglary rate immediately around the Gate at roughly 12.8 per 1,000 residents, far above the national 3.13. The famous painted terraces are also the most subdivided housing in the borough, which means the building’s security is only as good as its shared front door. That’s the call-out our Notting Hill locksmith team attends most: the flat door held; the communal door never stood a chance.
Holland Park (W11/W14). CrimeRate logged 70 burglaries in the 12 months to March 2026: 5.84 per 1,000, or 1.86 times the national average. Quiet, leafy and high-value is exactly the combination an experienced burglar plans around, and the rear-garden approaches here do most of the damage. Our Holland Park locksmith team’s standing advice: your back door deserves a better lock than your front one.
Ladbroke Grove & North Kensington (W10/W11). The trend line matters more than the level here: CrimeRate’s index has burglary in North Kensington running at 2.15 times the national average as of March 2026, up 46% on three years ago. This is one of the sharpest local rises we’ve seen in the data. Mixed housing standards street-to-street are precisely what opportunists scan for. Our Ladbroke Grove locksmith covers this patch around the clock.
Kensington (W8). The borough’s national number one ranking is, bluntly, W8’s problem too. Also, next door in Earl’s Court, the rate hits 11 burglaries per 1,000 (178 recorded in the year to April 2026), over three times the national average. What keeps individual W8 homes off the list is layered security; what puts them on it is the gaps: the basement flat below street level, the sash window on the first floor. It’s why our Kensington W8 locksmith fits more high-security upgrades here than anywhere else we work.
Chelsea (SW3) and South Kensington (SW7). Both sit inside the borough that now tops the national burglary table, and both share its signature weak points: converted period terraces, communal entrances, garden-square rears. If you’re on this side of the borough, our Chelsea locksmith and South Kensington locksmith teams cover you, and the advice in the next section applies double.
Paddington (W2). The hard number: 220 burglaries in the 12 months to April 2026: 5.63 per 1,000, 1.8 times the national average (CrimeRate). In one month alone, March 2025, police logged around 30 burglaries within half a mile of the station (StreetCheck). Westminster is also officially London’s most dangerous borough overall on CrimeRate’s 2026 figures, as there are 133 crimes per 1,000, 60% above the London average. However, its profile is led by theft rather than burglary. W2’s structural issue is the same as W11’s: stucco conversions where one communal lock guards six households. Our Paddington locksmith team replaces more communal-door locks than flat-door locks.
Bayswater (W2). Same postcode, same conversion-heavy housing, plus hotel-district footfall that makes an unfamiliar face unremarkable. The Paddington figures above are effectively Bayswater’s figures too. The CrimeRate neighbourhood boundary runs through the middle of both. Our Bayswater locksmith page covers the specifics for this side of the district.
Mayfair, Marylebone & the West End (W1). The W1 story is Westminster’s story: London’s highest-crime borough overall, driven by theft on Britain’s busiest streets. For W1 property owners, the burglary risk skews commercial: offices, galleries, stockrooms, and flats above shops where everyone assumes somebody else is watching the door. Our locksmith for Regent Street and W1B handles more commercial call-outs than anywhere else we cover.
Hammersmith (W6). Hammersmith and Fulham’s borough burglary rate runs at 6.57 per 1,000 residents (CrystalRoof, Dec 2024–Nov 2025). More than double the national rate, even before the borough’s transport-hub footfall is factored in. Every housing type London makes exists here, from riverside terraces to mansion blocks, and the risk profile changes street by street. Our Hammersmith locksmith team covers all of them.
Shepherd’s Bush (W12). In the Askew neighbourhood between the Bush and Hammersmith, CrimeRate logged 80 burglaries in the year to March 2026: 4.91 per 1,000, about 1.6 times the national average. High rental churn is the quiet risk factor here: a lot of locks that were never changed between tenants, which means a lot of keys in unknown hands.
Chiswick (W4). The quietest entry in our patch on paper, and the classic case of rear-entry burglary risk: affluent period homes whose original French doors and sashes face private gardens and back alleys. When our Chiswick locksmith attends a break-in here, it’s the back of the house far more often than the front.
What Actually Separates the Burgled Homes From the Rest
The uncomfortable truth from the aftermath of hundreds of West London break-ins: burglars rarely defeat good locks. They find the door that never had one. Four upgrades, in order of impact:
A cylinder that can’t be snapped. Lock snapping is the most common forced-entry method on London doors with euro cylinders; seconds of work on a standard cylinder. A high-security lock upgrade to an anti-snap, TS007 3-star or SS312 Diamond cylinder closes the single biggest route in.
A second point of resistance. One lock is a suggestion; two is a commitment most opportunists won’t make. On timber doors (most of K&C’s stock) a properly fitted deadbolt alongside the nightlatch is the cheapest major upgrade in home security, and it’s what BS3621 insurance requirements expect.
Knowing who holds your keys. In high-churn areas like W2 and W12, this is the big one: previous tenants, agents, cleaners and their contractors may all still hold working keys. Changing the locks after moving house removes an entire category of “burglary” that never has to force anything.
Matching the lock to the risk. For basement flats, street-level entrances and the communal doors that fill the data above, a patented, key-controlled system like Mul-T-Lock means keys can’t be copied at a kiosk and the cylinder resists snapping, drilling and picking.
None of this turns your home into a bunker. In most of the burgled homes we attend, the entire difference would have been one cylinder and twenty minutes.
Methodology & Sources
All figures originate in the Metropolitan Police’s public crime records, published monthly at police.uk under the Open Government Licence, as compiled by four independent analysis platforms: CrimeRate.co.uk (national, borough and neighbourhood burglary rates; 12-month windows ending between January and April 2026 as stated per figure), Plumplot (London-wide totals and trend, June 2025–May 2026), CrystalRoof (resident-population borough rates, December 2024–November 2025) and StreetCheck (single-month local counts).
Three honest caveats. First, “burglary” in police data includes business as well as residential burglary. Second, rates calculated on daytime population (CrimeRate) and resident population (CrystalRoof) aren’t interchangeable. We’ve labelled which is which, and the K&C finding holds on both measures. Third, neighbourhood boundaries are each platform’s own, not exact postcode districts. Anyone can verify every figure at the named sources or in the raw data at police.uk, we’d encourage it.
FAQs
Which part of West London has the highest burglary rate?
On the latest 2026 figures compiled by CrimeRate from police data, Kensington and Chelsea has the highest burglary rate not just in West London but in all of England and Wales — 6.68 burglaries per 1,000 daytime population, against a national average of 3.13. Within our patch, Earl’s Court (11 per 1,000), Holland Park (5.84) and Paddington (5.63) all run well above the national rate.
Does a high burglary rate make an area dangerous to live in?
Not in the way the word suggests. K&C tops the burglary table while remaining one of the most desirable places to live in Britain; the rate reflects property density, value and building type as much as anything else, and burglary figures include shops and offices, not just homes. The practical takeaway isn’t “avoid the area”; it’s that your building type (communal entrance, basement flat, garden access) matters more than your postcode.
Is burglary going up or down in London?
Down overall: London recorded about 47,400 burglaries in the year to May 2026, a 5.4% fall year on year, mirroring an 8% national fall. But the picture is uneven: parts of West London, like North Kensington, show burglary running well above the national average and rising against the three-year trend.
What’s the single best security upgrade against burglary?
For most London doors: replacing a standard euro cylinder with an anti-snap, TS007 3-star or SS312 Diamond rated cylinder, because cylinder snapping is the most common forced-entry method. After that, a British Standard BS3621 deadlock as a second locking point. Many home insurers now expect this on external doors. Both are under-an-hour jobs.
Live in one of these areas? We’re W Locksmith, based at Notting Hill Gate, in the middle of the borough this data is about. Our locksmiths are working around the clock every day. As a 24-hour locksmith across London, from security upgrades and respond to the 3am aftermath. Call 07830 787474, any hour, any day.